


Many highly desirable public institutions are opening
their doors wider to full paying out-of-state
students.
This is particularly
true in the University of California system (UC Berkeley reported admitting 30%
of their out-of-state pool; up 24%
from just three years ago).
In
addition, some highly coveted public universities like the University of
Virginia plan to increase tuition by 5.9% for out-of-state students.
See the following article.
Tuesday, June 24, 2014
Tuesday, June 17, 2014
National Trend #3 - STEM Growth
-->
Princeton, for example, admitted 25.3 percent of their overall admission pool who indicated they want to study engineering, and a record 43 percent of those students were women.
This tells me that schools like Casady need to make a concerted effort to strengthen their upper end M and S curriculum, resources and faculty, as well as add "T" curriculum like an online AP Computer Science course.
There may also be some legitimacy to adding an Intro to Engineering course down the line as well...or develop some project-based curriculum that integrates in aspects of basic engineering.
Many highly selective schools reported
major application spikes in science, technology, engineering and math
programs.
Duke’s Pratt School of Engineering, for example, reported a 20.2% increase in applications with
7,701.
See the following article.
Princeton, for example, admitted 25.3 percent of their overall admission pool who indicated they want to study engineering, and a record 43 percent of those students were women.
This tells me that schools like Casady need to make a concerted effort to strengthen their upper end M and S curriculum, resources and faculty, as well as add "T" curriculum like an online AP Computer Science course.
There may also be some legitimacy to adding an Intro to Engineering course down the line as well...or develop some project-based curriculum that integrates in aspects of basic engineering.


Monday, May 19, 2014
National Trend #2 - Early vs. Regular
My colleagues and I are not only fascinated by the totality of admission numbers - total applications, total admits, total wait listed, and total yields.
We are also intrigued by the dualities within highly selective admissions.
Specifically, the duality between early admissions versus regular admissions.
For some schools, the gap between early and regular admissions is widening.
Take Harvard, for example.
 Harvard took a fairly liberal portion from the early admission bucket.
11% more, in fact, than last year.
Regular admission admits remained fairly static...and bleak.
But then take Harvard's admissions rival.
Stanford.

Stanford took a more conservative number from their early admission bucket.
Here the gap between early and regular admissions isn't as acute.
Harvard admits more.
Stanford less.
This is an example of how it is getting harder to use traditional models and metrics to predict outcomes.
My colleague Patrick O' Connor underscores this reality in his article in the Huffington Post, and helps us understand that students must "expand their horizons" and create an "A list" and "B list" set of schools.
It feels analogously that highly selective admissions has become the equivalent of the Kentucky Derby.
The best of the best racing against each other for a better national ranking...now students look at the odds and place your bets!
One of my top students this year bet on Harvard. She bet on the right horse.
I had others that bet on other horses...and some won...others lost.
The analogy is not my favorite one, but it feels like that is the reality of highly selective admissions today.
What analogy might you use to describe this trend within the glut of absurd admission statistics?
We are also intrigued by the dualities within highly selective admissions.
Specifically, the duality between early admissions versus regular admissions.
For some schools, the gap between early and regular admissions is widening.
Take Harvard, for example.
11% more, in fact, than last year.
Regular admission admits remained fairly static...and bleak.
But then take Harvard's admissions rival.
Stanford.
Stanford took a more conservative number from their early admission bucket.
Here the gap between early and regular admissions isn't as acute.
Harvard admits more.
Stanford less.
This is an example of how it is getting harder to use traditional models and metrics to predict outcomes.
My colleague Patrick O' Connor underscores this reality in his article in the Huffington Post, and helps us understand that students must "expand their horizons" and create an "A list" and "B list" set of schools.
It feels analogously that highly selective admissions has become the equivalent of the Kentucky Derby.
The best of the best racing against each other for a better national ranking...now students look at the odds and place your bets!
One of my top students this year bet on Harvard. She bet on the right horse.
I had others that bet on other horses...and some won...others lost.
The analogy is not my favorite one, but it feels like that is the reality of highly selective admissions today.
What analogy might you use to describe this trend within the glut of absurd admission statistics?
Wednesday, May 14, 2014
National College Admission Trends (2013-14)
Over the next couple weeks, I will share with you national college admission trends that my colleagues have circled around in our conversations for the past few weeks.
I will be sharing these national trends with Casady's Board of Trustees tomorrow.
National Trend #1 - Business as Usual at the Top.
A colleague once remarked, "Highly selective colleges have the only business model I know of where their goal is to grow their business through customer dissatisfaction."
I would add potential customer dissatisfaction.
Every year, these schools turn more potential customers away in disappointment...and every year the line to try and get in is looonnnnngggggeeeeerrr!
Consequently, the majority of the most highly desirable schools saw increases in application volume and decreases in application rates.
Here is a statistical sampling:
-->
Here is a link to a Huffington Post article that expounds on the admission numbers at the top.
I will be sharing these national trends with Casady's Board of Trustees tomorrow.
National Trend #1 - Business as Usual at the Top.
A colleague once remarked, "Highly selective colleges have the only business model I know of where their goal is to grow their business through customer dissatisfaction."
I would add potential customer dissatisfaction.
Every year, these schools turn more potential customers away in disappointment...and every year the line to try and get in is looonnnnngggggeeeeerrr!
Consequently, the majority of the most highly desirable schools saw increases in application volume and decreases in application rates.
Here is a statistical sampling:
-->
Name: Applications Admits Admit
Rate
Stanford 42,167 2,138 5.07%
Harvard 34,295 2,023 6.26%
Yale 30,932 1,935 6.26%
Columbia 32,967 2,291 6.95%
Princeton 26,641 1,939 7.28%
Brown 30,432 2,619 8.86%
Penn 35,868 3,550 9.90%
Duke 32,457 1,705 10.80%
*Dartmouth 19,299 2,220 11.50%
*Vanderbilt 29,504 3,631 12.31%
Cornell 43,041 6,014 13.97%
* decrease in
applications
Here is a link to a Huffington Post article that expounds on the admission numbers at the top.
Thursday, May 8, 2014
Class of 2014 "College Day"
Today is our College Chapel.
We will celebrate the Casady Class of 2014 and their accomplishments.
We will announce where each of the 73 seniors are matriculating in the fall.
This was a "BCS year" for the Class of 2014.
Our Sugar Bowl win (still relishing the Sooner victory over Bama!).

First some college admission statistics about the Class of 2014.
Overall matriculation to 4-year colleges: 100%
Overall college admission rate: 74%
Overall admission: 95 different colleges and universities
Overall matriculation: 33 different colleges and universities
Out-of-state matriculation: 63%
In-state matriculation: 37%
Public institutions: 55%
Private institutions: 45%
Universities: 93.2%
Liberal Arts Colleges: 6.8%
Matriculation Location:
In State: 37%
Southeast: 36%
Northeast: 10%
Midwest: 10%
West: 6%
International: 1%
Total (reported) merit monies: $3 million
The 73 seniors of the Class of 2014 will matriculate to the following 34 colleges and universities:
Harvard College
Massachusetts Institute of Technology
University of Pennsylvania
Cornell University
Duke University
Vanderbilt University
Rice University*
Pomona College
Grinnell College
Tufts University
The University of Texas - Austin
University of Wisconsin-Madison
New York University
Boston University
University of Georgia
Indiana University - Bloomington
Texas Christian University*
Rhodes College
St. Olaf College
Earlham College
University of Puget Sound*
St. Edwards University
University of Arizona
University of Arkansas*
Florida State University
University of Tampa
St. Louis University
Baylor University*
Harding University
Xavier University (New Orleans)
Institute of Technology in Buenos Aires
University of Oklahoma*
Oklahoma State University*
Oklahoma Baptist University
* two or more students attending
Congrats to the Casady Class of 2014!!! We are proud of every college acceptance and every college matriculation!!!
It was an exciting adventure to partner with every one of you in discerning the best college fit!
Mission accomplished!!!
We will celebrate the Casady Class of 2014 and their accomplishments.
We will announce where each of the 73 seniors are matriculating in the fall.
This was a "BCS year" for the Class of 2014.
Our Sugar Bowl win (still relishing the Sooner victory over Bama!).
First some college admission statistics about the Class of 2014.
Overall matriculation to 4-year colleges: 100%
Overall college admission rate: 74%
Overall admission: 95 different colleges and universities
Overall matriculation: 33 different colleges and universities
Out-of-state matriculation: 63%
In-state matriculation: 37%
Public institutions: 55%
Private institutions: 45%
Universities: 93.2%
Liberal Arts Colleges: 6.8%
Matriculation Location:
In State: 37%
Southeast: 36%
Northeast: 10%
Midwest: 10%
West: 6%
International: 1%
Total (reported) merit monies: $3 million
The 73 seniors of the Class of 2014 will matriculate to the following 34 colleges and universities:
Harvard College
Massachusetts Institute of Technology
University of Pennsylvania
Cornell University
Duke University
Vanderbilt University
Rice University*
Pomona College
Grinnell College
Tufts University
The University of Texas - Austin
University of Wisconsin-Madison
New York University
Boston University
University of Georgia
Indiana University - Bloomington
Texas Christian University*
Rhodes College
St. Olaf College
Earlham College
University of Puget Sound*
St. Edwards University
University of Arizona
University of Arkansas*
Florida State University
University of Tampa
St. Louis University
Baylor University*
Harding University
Xavier University (New Orleans)
Institute of Technology in Buenos Aires
University of Oklahoma*
Oklahoma State University*
Oklahoma Baptist University
* two or more students attending
Congrats to the Casady Class of 2014!!! We are proud of every college acceptance and every college matriculation!!!
It was an exciting adventure to partner with every one of you in discerning the best college fit!
Mission accomplished!!!
Monday, April 14, 2014
Highly Selective Admissions Then and Now
Last week a colleague and I presented to packed room at GPACAC on Highly Selective Admissions: Then and Now.
Here is a link to the prezi.
We provided our audience a cadre of articles on this topic as well.
There is this one on Stanford's 5% admit rate.
And this one on Stanford denying 69% of their applicants with perfect SAT scores.
And this one on major trends for next year's seniors (20% rule is very helpful!).
And this one with Ivy admission statistics (higher volume + lower admit rate = business as usual).
Have a great week.
Here is a link to the prezi.
We provided our audience a cadre of articles on this topic as well.
There is this one on Stanford's 5% admit rate.
And this one on Stanford denying 69% of their applicants with perfect SAT scores.
And this one on major trends for next year's seniors (20% rule is very helpful!).
And this one with Ivy admission statistics (higher volume + lower admit rate = business as usual).
Have a great week.
Thursday, March 27, 2014
Admission Decisions Today (5 pm eastern time) and Icebergs
As highly selective admissions announce their decisions today and next week (here are the numbers!), the question in the aftermath [for counselors like me] is always this one:
If 85-90% of the students applying to these schools are admissible (according to the admission deans), then how do these admission officers make their decisions?
I would offer my iceberg analogy.
This is something I drew up on a napkin while listening to Bill Fitzsimmons talk about admissions at Harvard at the Harvard Institute.

90% of the reasons why or why not are underneath the surface.
Where we will never know why.
Which often then translates to students beating themselves up over the 10% above the surface that had NOTHING to do with the decision made.
If 85-90% of the students applying to these schools are admissible (according to the admission deans), then how do these admission officers make their decisions?
I would offer my iceberg analogy.
This is something I drew up on a napkin while listening to Bill Fitzsimmons talk about admissions at Harvard at the Harvard Institute.
90% of the reasons why or why not are underneath the surface.
Where we will never know why.
Which often then translates to students beating themselves up over the 10% above the surface that had NOTHING to do with the decision made.
Tuesday, March 25, 2014
Bracketology and Highly Selective College Admissions
How's your NCAA bracket looking?
Confession.
I filled out 8 brackets.
And all of them have been blown to smithereens.

I'm proud to say though I picked Dayton vs. Stanford.
I'm not proud to say I also picked Western Michigan, Louisiana Lafayette, and Western Kentucky.
Which brings me to the correlation between bracketology and highly selective admissions.
We're about to enter the two major 24 hour windows of time where all the #1 seeds reveal their winners and losers...and maybes.
I probably have 68 or so admission decisions pending for my students at those "blue blood" schools.
Enough to fill out a NCAA-like bracket.
And mentally I do it every year.
I try my best to prognosticate who will win and advance and who will lose and well go somewhere else.
And every year I do about as well in my "highly selective admission bracket" as I do in my NCAA bracket.
There are kids who like Mercer don't beat Duke but get into Duke...and I didn't see it coming.
And there are kids who like Wichita State are undefeated in college admissions right up until April 1st and then they get smeared...and I didn't see it coming.
The reality is that highly selective admissions is simply too unpredictable these days.
The application volume. Plus...
The pressures for greater selectivity (which means lower admit rates and higher yield rates). Plus...
The institutional agenda. Plus...
The hidden variables that come into play in making very complex, highly nuanced decisions.
This article is an excellent reminder of what a "crap shoot" highly selective admissions is today.
As Mr. Gould points out in the following article, admission decisions say very little about the student, and much more about the institution making those decisions.
In the end, if a student's application list is balanced, then that student will have some excellent final choices that a majority of 18-year old's would give anything for.
March Madness is certainly my favorite time of year (other than the Masters in April) as a sports fan...but my least favorite time of the year as a college counselor.
But in the end, I'm always surprised how each student ends up where he or she is able to get a great college education.
Confession.
I filled out 8 brackets.
And all of them have been blown to smithereens.
I'm proud to say though I picked Dayton vs. Stanford.
I'm not proud to say I also picked Western Michigan, Louisiana Lafayette, and Western Kentucky.
Which brings me to the correlation between bracketology and highly selective admissions.
We're about to enter the two major 24 hour windows of time where all the #1 seeds reveal their winners and losers...and maybes.
I probably have 68 or so admission decisions pending for my students at those "blue blood" schools.
Enough to fill out a NCAA-like bracket.
And mentally I do it every year.
I try my best to prognosticate who will win and advance and who will lose and well go somewhere else.
And every year I do about as well in my "highly selective admission bracket" as I do in my NCAA bracket.
There are kids who like Mercer don't beat Duke but get into Duke...and I didn't see it coming.
And there are kids who like Wichita State are undefeated in college admissions right up until April 1st and then they get smeared...and I didn't see it coming.
The reality is that highly selective admissions is simply too unpredictable these days.
The application volume. Plus...
The pressures for greater selectivity (which means lower admit rates and higher yield rates). Plus...
The institutional agenda. Plus...
The hidden variables that come into play in making very complex, highly nuanced decisions.
This article is an excellent reminder of what a "crap shoot" highly selective admissions is today.
As Mr. Gould points out in the following article, admission decisions say very little about the student, and much more about the institution making those decisions.
In the end, if a student's application list is balanced, then that student will have some excellent final choices that a majority of 18-year old's would give anything for.
March Madness is certainly my favorite time of year (other than the Masters in April) as a sports fan...but my least favorite time of the year as a college counselor.
But in the end, I'm always surprised how each student ends up where he or she is able to get a great college education.
Tuesday, March 11, 2014
The Story Behind the SAT Overhaul....Excellent Read

The article raises important questions about standardized testing.
The reality is that standardized testing has simply reinforced the savage inequalities that have existed socioeconomically.
Standardized tests advantage the advantaged.
And disadvantage the disadvantaged.
Scores, in other words, reveal zip codes and income brackets.
Not raw acumen and intellectual ability.
Not to mention intellectual curiosity and creativity and innovation (does any standardized test reveal this?).
Standardized tests are here to stay...at least at 80% of the colleges and universities out there.
It's a $4.5 billion dollar cash cow for the empire called The College Board.
Hopefully though the new SAT will provide ways to create a more even playing field for students.
Thursday, March 6, 2014
New SAT 1 Unveiled
I was at the Harvard Summer Institute last June when College Board President, David Coleman, gave us - college deans and counselors - a sneak preview of the radical changes coming to the SAT 1.
Two sections only again.
Scored on the traditional 1600 scale.
An optional essay. What....optional?
"Real world" vocabulary words.
So fewer words like parsimonious and inchoate.
And more words like synthesis and adaptability.
21st century words, in other words.
Data driven math.
Evidence-based literary analysis.
Less archaic and more relevant literature.
Like MLK's Letter from a Birmingham Jail.
And the Declaration of Independence.
And health care equivalent of free, universal test prep through Khan Academy!
This is a step in good direction....IF colleges and universities are going to continue to use standardized test scores to conquer and divide...excuse me, I mean bolster their ranking status...I mean evaluate the applicant's ability to succeed in their freshman year.
Nevertheless, I'm not sure if a overhauled test will change the fact that only 42% (according to the College Board) of the US test taking population scored high enough to qualify as "college ready."
That said, I don't foresee the new SAT 1 having a significant impact on the Casady community.
We have steadily seen 15% of our seniors submit SAT I scores to colleges.
85% still prefer and score highest on the ACT.
But it will certainly change the game for our kids in terms of the PSAT...and National Merit.
Here is a link to an excellent article explaining the new SAT 1 that will be fully functional in the spring of 2016.
Two sections only again.
Scored on the traditional 1600 scale.
An optional essay. What....optional?
"Real world" vocabulary words.
So fewer words like parsimonious and inchoate.
And more words like synthesis and adaptability.
21st century words, in other words.
Data driven math.
Evidence-based literary analysis.
Less archaic and more relevant literature.
Like MLK's Letter from a Birmingham Jail.
And the Declaration of Independence.
And health care equivalent of free, universal test prep through Khan Academy!
This is a step in good direction....IF colleges and universities are going to continue to use standardized test scores to conquer and divide...excuse me, I mean bolster their ranking status...I mean evaluate the applicant's ability to succeed in their freshman year.
Nevertheless, I'm not sure if a overhauled test will change the fact that only 42% (according to the College Board) of the US test taking population scored high enough to qualify as "college ready."
That said, I don't foresee the new SAT 1 having a significant impact on the Casady community.
We have steadily seen 15% of our seniors submit SAT I scores to colleges.
85% still prefer and score highest on the ACT.
But it will certainly change the game for our kids in terms of the PSAT...and National Merit.
Here is a link to an excellent article explaining the new SAT 1 that will be fully functional in the spring of 2016.
Saturday, February 8, 2014
Interesting in Out-of-State Public U's?
One major trend emerging in higher education involves the rising costs of attending an out-of-state universities.
It's generally understood that non-residents can anticipate paying twice what in-state resident students pay at flagship public universities.
But now public institutions are becoming increasingly "need aware" in the admission process.
At the Harvard Institute this last summer, I heard a number of deans of admission from highly selective public universities flat out say, "We're looking for full pay kids."
Bottom line: students and families need to become more aware of how "need aware" policies are factoring into admission decisions.
This article sheds light on this emerging trend. It's worth taking the time to read it.
It's generally understood that non-residents can anticipate paying twice what in-state resident students pay at flagship public universities.
But now public institutions are becoming increasingly "need aware" in the admission process.
At the Harvard Institute this last summer, I heard a number of deans of admission from highly selective public universities flat out say, "We're looking for full pay kids."
Bottom line: students and families need to become more aware of how "need aware" policies are factoring into admission decisions.
This article sheds light on this emerging trend. It's worth taking the time to read it.
Tuesday, January 14, 2014
What is Confounding, Absurd, and Miasmic? Here's a Hint: It starts with a S and ends with P, H, Y
Recently a colleague sent me this article from the Stanford Magazine.
It explored the confounding, absurd, and miasmic underbelly of highly selective admissions.
It's crazy to think that last year at Stanford, for example, as the article points out, that 69% of the applicants who had perfect SAT scores were denied.
800 + 800 + 800 = No Thanks!
This little juicy factoid underscores again that the schools at the top of the food chain have a set of hidden agendas (aka "institutional goals") that drive this admission process.
One of the graphics that I found helpful was this one.

This graph reveals the meteoric rise in applications to the Big 3 + Stanford over the last decade.
As well as the sharp plunge in the admit rate.
Now when any student or family in the future comes to me with ambitions to gain admission to one of these schools, I have a great introductory article to provide them to calibrate their expectations.
Thanks, Stanford.
It explored the confounding, absurd, and miasmic underbelly of highly selective admissions.
It's crazy to think that last year at Stanford, for example, as the article points out, that 69% of the applicants who had perfect SAT scores were denied.
800 + 800 + 800 = No Thanks!
This little juicy factoid underscores again that the schools at the top of the food chain have a set of hidden agendas (aka "institutional goals") that drive this admission process.
One of the graphics that I found helpful was this one.

This graph reveals the meteoric rise in applications to the Big 3 + Stanford over the last decade.
As well as the sharp plunge in the admit rate.
Now when any student or family in the future comes to me with ambitions to gain admission to one of these schools, I have a great introductory article to provide them to calibrate their expectations.
Thanks, Stanford.
Thursday, December 19, 2013
Early College Acceptances!!!!
For the past week, Casady seniors have been hearing back from colleges and universities that they applied to early
So far our 74 seniors have been admitted to 41 different schools.
This list grows by the day.
In the midst of the most competitive admission cycle in US history, the Class of 2014 has had incredible success among some of the most prestigious technological, research, and liberal arts schools in the US and abroad.
That said, we are proud of EVERY college acceptance that our seniors have received thus far...and to come in the months ahead!
Our mission continues to focus on finding the best college fit for each student.
Click here to see a map of where the Class of 2014 has already found a college fit!
So far our 74 seniors have been admitted to 41 different schools.
This list grows by the day.
In the midst of the most competitive admission cycle in US history, the Class of 2014 has had incredible success among some of the most prestigious technological, research, and liberal arts schools in the US and abroad.
That said, we are proud of EVERY college acceptance that our seniors have received thus far...and to come in the months ahead!
Our mission continues to focus on finding the best college fit for each student.
Click here to see a map of where the Class of 2014 has already found a college fit!
Sunday, December 1, 2013
Is your student receiving a college admission decision soon? (revisiting an old post)
(I wrote this blog post last year. I thought it was worth recycling as seniors enter into the admission results season again!)
It's that time of year again.
Early admission decisions are coming out.
The wait will finally be over.
And reality will come to roost.
I was asked by my headmaster yesterday what the "early forecast" looks like for our students.
Talk about being put on the spot in our administrative meeting.
My response.
 The weather doppler shows an early winter mix of snow and sunshine.
Emily Dickinson gave great advice when she poetically waxed:
"Tell the truth but tell it slant."
Metaphors are helpful "slants" (/) to convey hard truths.
---
Just today The Choice blog published a post on advice for parents and students who are receiving news from colleges.
Many of my colleagues had excellent insights and anecdotes to illustrate the do's and don'ts.
The story of the mom recording "the moment" and failing to see her daughter sobbing because of the bad news - that's a "parent fail" moment (not that I haven't already had a bevy of fail moments with my 6 year old)
Or the parent who ordered two different Christmas cards.
One with the daughter in her Duke sweatshirt.
The other with her daughter in another outfit.
Truth is stranger than fiction sometimes - isn't it?
---
One thing I have to keep in mind is that this is not my moment.
It's not about me.
This is the student's moment.
My job in that student's moment is to try and practice what Harvard professor and theologian Henri Nouwen called the "ministry of presence."
To minister presence simply means being present in the present with the person in my presence.
This is never easy to do.
I have to resist the impulse to "fix" the situation.
I'm learning though that it is OK for things not to be OK.
---
All of us deep down hate to see our kids suffer disappointment.
We are a pain aversion society - aren't we?
We're a Happy Meal culture.
We're a Lake Woebegone world where every kid is now well above average.
We don't want to acknowledge that most meaningful success stories are shaped by a trajectory of suffering.
People who end up really mattering to the world are people who end up enduring great suffering to matter to the world.
 I'm reading Team of Rivals right now, for example.
I've been amazed in just the first 100 pages by how Lincoln's suffering in his formative years molded his character.
And I've been equally amazed at how Lincoln handled personal loss and political defeat.
He wasn't a Clint Eastwood type.
He didn't just grit it out.
Lincoln grieved it out.
He had unstinting bouts of "hypocondria" that drove him to the edge of despair.
But it's that emotional edge that ultimately gave Lincoln his moral edge.
Lincoln wouldn't have been Lincoln without the personal and political set backs.
One salient thing Lincoln possessed during his lifetime was the ability to navigate those painful moments through story telling and good humor.
Lincoln found ways in moments punctuated by grave disappointment or ferocious intensity to keep his sanity and perspective by telling a funny, homespun anecdote he gleaned from his father while growing up in the backwoods of Kentucky.
The film Lincoln illustrates this poignantly when Lincoln tells a crude story about a toilet and portrait of George Washington that had his entire cabinet in raucous fits just moments before they received critical news from the Civil War battle front.
Perhaps there is something we can all glean from Lincoln here.
--
Often times the best thing to do when it is bad news for kids is not to say anything all.
"Chicken Soup words" just don't warm the soul.
It's best to do what Jews have done down through the centuries amid suffering.
Call it the ancient practice of just shutting up and being silently with.
A hug. Tears. A steaming cup of hot chocolate with marshmallows bobbing on the frothy surface.
 A fun Christmas movie like Elf.
Moreover, it's best for this moment [when the student thumbs open the letter, or clicks on to his or her admission portal] to occur in a private place with supportive people.
It's days or weeks after that I will try to reasonably explain the hidden perils that may have factored into the unfavorable application decision.
Especially at highly selective institutions where the goal is for the admission officer to find a reason not to admit the student.
I often begin by reminding the crestfallen student that the college made a decision on a 10 to 20 minute application review, as well as a set of institutional goals that the student may or may not have fit into as an applicant.
In other words, this college didn't deny you.
They denied your application.
Sometimes the college is denying your application because on page one they saw that you didn't fit a certain geographical demographic or ethnic demographic.
Or you checked off one gender box instead of the other.
Or that you chose an academic major that is full.
Or that you have a smattering of B's and C's from your freshman year.
Or that you took a freshman level course like Chinese 1 in your senior academic program.
Or that you took Honors US History instead of AP US History.
Or that your activities chart was too thin. (They needed more generalist).
Or that your activities chart was too thick. (They needed more specialist).
Or that you didn't check the "plan to participate in college" box.
Or that your parents didn't attend this particular college.
Or that your test score was "profile negative" by a single point.
There are a myriad of reasons that a student's application is admitted, deferred, or denied that is beyond one's control.
Beyond my control.
Beyond your parent's control.
Beyond some rich alumnus's control.
Just beyond.
And not being able to manipulate the results just plain sucks.
--
Life is moments.
And this will be for your student one of those moments.
It's not the ultimate moment.
It's just one moment among many moments that will shape them.
Looking back, I realize now that often the moment isn't about the news.
It's about the person's response.
I also realize that the moment isn't meant to be a solitary event.
It's meant to be a communal moment.
Some moments, in other words, are meant to be shared.
 Any disappointment can be absorbed and overcome in the presence of someone who cares, supports, encourages, and ultimately loves you.
I often remind parents in our first college meeting that a study has shown that a parent has roughly 3000 hours to influence a child.
That's 3000 dots.
No dots are more impacting than dots of love.
For in the end, love is always presence.
Every one of us needs to hear, regardless if we are hearing back from a college, that we are loved simply because.
It's that time of year again.
Early admission decisions are coming out.
The wait will finally be over.
And reality will come to roost.
I was asked by my headmaster yesterday what the "early forecast" looks like for our students.
Talk about being put on the spot in our administrative meeting.
My response.

Emily Dickinson gave great advice when she poetically waxed:
"Tell the truth but tell it slant."
Metaphors are helpful "slants" (/) to convey hard truths.
---
Just today The Choice blog published a post on advice for parents and students who are receiving news from colleges.
Many of my colleagues had excellent insights and anecdotes to illustrate the do's and don'ts.
The story of the mom recording "the moment" and failing to see her daughter sobbing because of the bad news - that's a "parent fail" moment (not that I haven't already had a bevy of fail moments with my 6 year old)
Or the parent who ordered two different Christmas cards.
One with the daughter in her Duke sweatshirt.
The other with her daughter in another outfit.
Truth is stranger than fiction sometimes - isn't it?
---
One thing I have to keep in mind is that this is not my moment.
It's not about me.
This is the student's moment.
My job in that student's moment is to try and practice what Harvard professor and theologian Henri Nouwen called the "ministry of presence."
To minister presence simply means being present in the present with the person in my presence.
This is never easy to do.
I have to resist the impulse to "fix" the situation.
I'm learning though that it is OK for things not to be OK.
---
All of us deep down hate to see our kids suffer disappointment.
We are a pain aversion society - aren't we?
We're a Happy Meal culture.
We're a Lake Woebegone world where every kid is now well above average.
We don't want to acknowledge that most meaningful success stories are shaped by a trajectory of suffering.
People who end up really mattering to the world are people who end up enduring great suffering to matter to the world.
I've been amazed in just the first 100 pages by how Lincoln's suffering in his formative years molded his character.
And I've been equally amazed at how Lincoln handled personal loss and political defeat.
He wasn't a Clint Eastwood type.
He didn't just grit it out.
Lincoln grieved it out.
He had unstinting bouts of "hypocondria" that drove him to the edge of despair.
But it's that emotional edge that ultimately gave Lincoln his moral edge.
Lincoln wouldn't have been Lincoln without the personal and political set backs.
One salient thing Lincoln possessed during his lifetime was the ability to navigate those painful moments through story telling and good humor.
Lincoln found ways in moments punctuated by grave disappointment or ferocious intensity to keep his sanity and perspective by telling a funny, homespun anecdote he gleaned from his father while growing up in the backwoods of Kentucky.
The film Lincoln illustrates this poignantly when Lincoln tells a crude story about a toilet and portrait of George Washington that had his entire cabinet in raucous fits just moments before they received critical news from the Civil War battle front.
Perhaps there is something we can all glean from Lincoln here.
--
Often times the best thing to do when it is bad news for kids is not to say anything all.
"Chicken Soup words" just don't warm the soul.
It's best to do what Jews have done down through the centuries amid suffering.
Call it the ancient practice of just shutting up and being silently with.
A hug. Tears. A steaming cup of hot chocolate with marshmallows bobbing on the frothy surface.
Moreover, it's best for this moment [when the student thumbs open the letter, or clicks on to his or her admission portal] to occur in a private place with supportive people.
It's days or weeks after that I will try to reasonably explain the hidden perils that may have factored into the unfavorable application decision.
Especially at highly selective institutions where the goal is for the admission officer to find a reason not to admit the student.
I often begin by reminding the crestfallen student that the college made a decision on a 10 to 20 minute application review, as well as a set of institutional goals that the student may or may not have fit into as an applicant.
In other words, this college didn't deny you.
They denied your application.
Sometimes the college is denying your application because on page one they saw that you didn't fit a certain geographical demographic or ethnic demographic.
Or you checked off one gender box instead of the other.
Or that you chose an academic major that is full.
Or that you have a smattering of B's and C's from your freshman year.
Or that you took a freshman level course like Chinese 1 in your senior academic program.
Or that you took Honors US History instead of AP US History.
Or that your activities chart was too thin. (They needed more generalist).
Or that your activities chart was too thick. (They needed more specialist).
Or that you didn't check the "plan to participate in college" box.
Or that your parents didn't attend this particular college.
Or that your test score was "profile negative" by a single point.
There are a myriad of reasons that a student's application is admitted, deferred, or denied that is beyond one's control.
Beyond my control.
Beyond your parent's control.
Beyond some rich alumnus's control.
Just beyond.
And not being able to manipulate the results just plain sucks.
--
Life is moments.
And this will be for your student one of those moments.
It's not the ultimate moment.
It's just one moment among many moments that will shape them.
Looking back, I realize now that often the moment isn't about the news.
It's about the person's response.
I also realize that the moment isn't meant to be a solitary event.
It's meant to be a communal moment.
Some moments, in other words, are meant to be shared.

I often remind parents in our first college meeting that a study has shown that a parent has roughly 3000 hours to influence a child.
That's 3000 dots.
No dots are more impacting than dots of love.
For in the end, love is always presence.
Every one of us needs to hear, regardless if we are hearing back from a college, that we are loved simply because.
Wednesday, September 11, 2013

Tuesday, May 14, 2013
National 2013 College Admissions Trends
Every year at about this time, I submit my Board of Trustees report on college admissions.
My report includes a summary of major trends in the college admission world for this year.

My report includes a summary of major trends in the college admission world for this year.
Major College Admission Trends
Highly Selective
Admissions “Arms Race”…Continues

The arms race in highly selective college admission
continued this year. Seven of the
eight Ivies reported increases in
applications and decreases in
admissions. At least twenty-two
universities reported 30,000+ application totals. Factors contributing to the arms race include growing first
generation applicant pools;
growing international applicant pools; the popularity/accessibility of the Common Application; “attract to reject” marketing; financial aid anxiety.
Here are a selected handful of admission statistics reported
by institutions:
Apps Admit%
(St. Louis)
·
The Times
Choice blog provides more exhaustive statistics. Click here to peruse statistics.
“Resource Aware”
Schools vs. “Discount Aware” Parents
There is a growing tension between colleges becoming more
“resource aware” (aka “full pay hunting”) versus parents becoming more “discount aware” (aka “coupon hunter”).
Popularity
of Early Decision = Dissolving Advantage
More students are getting savvy about the “game
within the college admission game” and applying into early decision
pools; however, schools aren't necessarily admitting more in early
decision. As a result, the strategic advantage of applying early is
waning. In 2007, for example, a
student applying early decision had a 12-15% advantage; last year it was
6%.
ACT Trumps SAT in
Popularity
For the first time in US history, the ACT was more popular
among high school test takers than the SAT. Notably, this year, 90% of our seniors scored higher on the
ACT than the SAT. Colleges will
take either the ACT or SAT for admission review (there are also 800+
colleges/universities that are test optional. To peruse this list click here. Moreover, the ACT recently announced that they will be offering their test
online (iPads) in the spring of 2015.
Monday, May 6, 2013
Casady's Class of 2013 College Acceptances and Matriculations
Today is College Day for our seniors!
It's a Casady School tradition for our seniors to wear their college t-shirt on this day as a way to publically announce to the community where they will be matriculating in the fall.
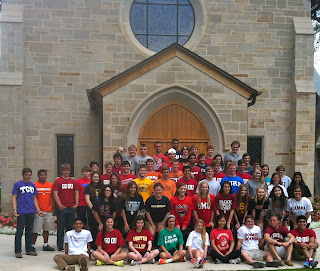
Our college counseling office couldn't be prouder of the Class of 2013 and the colleges they have chosen.
Statistics can never fully reveal the myriad of reasons for why a student chose the college they did.
Story is a much more effective medium.
And I wish I had the time and space to tell each student's story.
But I'll share some statistics nevertheless.
It's been well documented that this has been the most brutal year in highly selective admissions (click here to see 100+ admission statistics.)
Take, as one salient example, Vanderbilt University.
Vandy received 31, 056 applications.
Vandy only admitted 11.97%.
Vandy is a microcosm of what we saw across the entire college landscape.
We saw historic highs in applications - 99,000 at UC- Berkeley.
We saw historic lows in admissions - 6.72% at Yale, 5.79% at Harvard.
And yet, in the midst of such historic highs and lows, our seniors had historic success in terms of overall college acceptances.
188 applications (out of 265 total applications from our 60 seniors) were deemed worthy of admission at 71 different colleges and universities.
From Ivies. To "Public Ivies".
From Big 12. To Big 10.
From Pac-12. To SEC.
From single sex schools. To military academies.
From small, liberal arts colleges. To mid-size private, research universities.
This small, senior class really embraced in a big way the spirit of adventure.
54% of our seniors will be matriculating out of state to 31 different colleges and universities.
The other 46% will stay in state to attend 5 different universities.
58% will attend public institutions.
42% will attend private institutions.
8% will matriculate to liberal arts colleges.
92% will matriculate to universities.
To date our seniors have been offered almost $4 million in scholarship monies.
Now to my favorite statistic.
12.
12 is the number of new stickers that we will be adding to our "Cyclone College Bound" map.
Each sticker represents colleges and universities that a Casady student has either not chosen in many years, or never chosen before.

12 is a number that says that our students are broadening the horizons of the possible in terms of great college fits for Casady students.
12 is a number that underscores the fact that more colleges are getting to know how exceptional students are that hale from Casady School.
Okay, with that said, it is time to roll out the Class of 2013 complete acceptance and matriculation list.
Acceptances are in blue.
Matriculation are in red.
University of Alabama (new sticker!)
American University
Arizona State University
University of Arkansas
Austin College
Barnard College (Columbia University)
Baylor University
Boston University
Bryn Mawr College
University of Central Oklahoma (3)
Centre College
University of Colorado - Boulder
Colorado School of Mines (new sticker!)
University of Denver
Duke University
Earlham College
Elon University
Emory University
Fort Lewis College
Furman University (new sticker!)
The George Washington University (new sticker!)
Georgetown University
Harding University
Hendrix College
High Point University (new sticker!)
Kansas State University
King's College
Lake Forest College
Langston University
Lindenwood University
Loyola Marymount University
Lyon College
University of Mississippi
Missouri Baptist University (new sticker!)
Missouri University of Science and Technology
University of Missouri-Columbia
New York University
Newman University
University of North Carolina - Chapel Hill
Northeastern University
Northwestern University
Oklahoma Baptist University (new sticker!)
Oklahoma City University
Oklahoma State University (3)
Oklahoma State University - Oklahoma City
University of Oklahoma (19)
Oxford College of Emory University
Pepperdine University
Randolph College
Randolph-Macon College (new sticker!)
Rhodes College
Saint Louis University
University of San Diego
University of Southern California (new sticker!)
Southern Methodist University (4)
Southwestern University
St. Edward's University (new sticker!)
TAMU
University of Texas - Austin (2)
Texas Christian University
Trinity University
University of Tulsa
United States Air Force Academy
United States Coast Guard Academy
United States Military Academy at West Point (2)
United States Naval Academy
University of Virginia
Washington University in St. Louis
Wellesley College
University of Wisconsin - Madison (new sticker!)
Vanderbilt University
Yale University (new sticker!)
On behalf of our entire office, we are SO PROUD of the Class of 2013!
And we wish each of you the best as you pursue your passions and interests in college.
Please come back and visit us and share your college experience.
We want to hear of all the ways the college you chose has been an excellent college fit!
It's a Casady School tradition for our seniors to wear their college t-shirt on this day as a way to publically announce to the community where they will be matriculating in the fall.

Our college counseling office couldn't be prouder of the Class of 2013 and the colleges they have chosen.
Statistics can never fully reveal the myriad of reasons for why a student chose the college they did.
Story is a much more effective medium.
And I wish I had the time and space to tell each student's story.
But I'll share some statistics nevertheless.
It's been well documented that this has been the most brutal year in highly selective admissions (click here to see 100+ admission statistics.)
Take, as one salient example, Vanderbilt University.
Vandy received 31, 056 applications.
Vandy only admitted 11.97%.
Vandy is a microcosm of what we saw across the entire college landscape.
We saw historic highs in applications - 99,000 at UC- Berkeley.
We saw historic lows in admissions - 6.72% at Yale, 5.79% at Harvard.
And yet, in the midst of such historic highs and lows, our seniors had historic success in terms of overall college acceptances.
188 applications (out of 265 total applications from our 60 seniors) were deemed worthy of admission at 71 different colleges and universities.
From Ivies. To "Public Ivies".
From Big 12. To Big 10.
From Pac-12. To SEC.
From single sex schools. To military academies.
From small, liberal arts colleges. To mid-size private, research universities.
This small, senior class really embraced in a big way the spirit of adventure.
54% of our seniors will be matriculating out of state to 31 different colleges and universities.
The other 46% will stay in state to attend 5 different universities.
58% will attend public institutions.
42% will attend private institutions.
8% will matriculate to liberal arts colleges.
92% will matriculate to universities.
To date our seniors have been offered almost $4 million in scholarship monies.
Now to my favorite statistic.
12.
12 is the number of new stickers that we will be adding to our "Cyclone College Bound" map.
Each sticker represents colleges and universities that a Casady student has either not chosen in many years, or never chosen before.

12 is a number that says that our students are broadening the horizons of the possible in terms of great college fits for Casady students.
12 is a number that underscores the fact that more colleges are getting to know how exceptional students are that hale from Casady School.
Okay, with that said, it is time to roll out the Class of 2013 complete acceptance and matriculation list.
Acceptances are in blue.
Matriculation are in red.
University of Alabama (new sticker!)
American University
Arizona State University
University of Arkansas
Austin College
Barnard College (Columbia University)
Baylor University
Boston University
Bryn Mawr College
University of Central Oklahoma (3)
Centre College
University of Colorado - Boulder
Colorado School of Mines (new sticker!)
University of Denver
Duke University
Earlham College
Elon University
Emory University
Fort Lewis College
Furman University (new sticker!)
The George Washington University (new sticker!)
Georgetown University
Harding University
Hendrix College
High Point University (new sticker!)
Kansas State University
King's College
Lake Forest College
Langston University
Lindenwood University
Loyola Marymount University
Lyon College
University of Mississippi
Missouri Baptist University (new sticker!)
Missouri University of Science and Technology
University of Missouri-Columbia
New York University
Newman University
University of North Carolina - Chapel Hill
Northeastern University
Northwestern University
Oklahoma Baptist University (new sticker!)
Oklahoma City University
Oklahoma State University (3)
Oklahoma State University - Oklahoma City
University of Oklahoma (19)
Oxford College of Emory University
Pepperdine University
Randolph College
Randolph-Macon College (new sticker!)
Rhodes College
Saint Louis University
University of San Diego
University of Southern California (new sticker!)
Southern Methodist University (4)
Southwestern University
St. Edward's University (new sticker!)
TAMU
University of Texas - Austin (2)
Texas Christian University
Trinity University
University of Tulsa
United States Air Force Academy
United States Coast Guard Academy
United States Military Academy at West Point (2)
United States Naval Academy
University of Virginia
Washington University in St. Louis
Wellesley College
University of Wisconsin - Madison (new sticker!)
Vanderbilt University
Yale University (new sticker!)
On behalf of our entire office, we are SO PROUD of the Class of 2013!
And we wish each of you the best as you pursue your passions and interests in college.
Please come back and visit us and share your college experience.
We want to hear of all the ways the college you chose has been an excellent college fit!
Wednesday, April 17, 2013
Wait Listed? Simple Strategies Going Forward
Most of our seniors this year got a clean cut in regular admissions.
Our 61 seniors, for example, submitted 265 applications.
Only 11 apps were wait listed.
And only 1 senior is pursuing a spot via the wait list.

So for that 1 student, I've given them simple advice.
First, let the college know you want a spot.
Second, send the college rep only new information - new awards, new recognitions, new grades, etc.
Third, consider sending the college rep a short, new essay on why that college.
Fourth, try to seek out an alumni of that college who knows you and can advocate for you in a letter.
Most college reps won't admit this, but they are tired. So keep everything tight, terse, and brief.
Fifth, plan on depositing May 1st to an admitted college.
Many colleges will not go to their wait list until after May 1st when they get a clearer picture of what spots are open.
That's it.
Wait list, unfortunately, require waiting.
And sometimes good things come to those who wait.
And other times - they don't.
That proverbial wisdom often proves true for finding a spouse. Or getting a great deal on a car.
But not necessarily a spot at a desired college.
A recent article enumerated on anticipated wait list trends this year.
Here are a handful of more statistics from that article.
About 55% of colleges will create and use a wait list.
Most of those 55% will put roughly 9% of their application pool on the wait list.
Cornell is a great example of this trend. Cornell had 40,006 applications. They put 3,146 on the wait list.
Some schools will put more. Take Emory. They had 17,698 applications. They put 4,113 on the wait list.
Some will put less. Take Princeton. They had 26, 498. They put 1,395 on the wait list.
The Times recently posted admission statistics for many highly selective schools. They also provided wait list numbers. Click here to review statistics.
Overall, colleges are taking on average 31% from the wait list.
Notably, highly selective schools are taking almost 17% from their wait list.
Usually, I tell my kids that the more selective the school is, the less likely they will be admitted off the waist list. In that case, I tell my kids to see a wait list as a consolation prize, and that they need to move forward, deposit May 1st at a school that has admitted them, buy the t-shirt, and celebrate the exciting opportunities that await them in the next chapter of their life story.
Our 61 seniors, for example, submitted 265 applications.
Only 11 apps were wait listed.
And only 1 senior is pursuing a spot via the wait list.

So for that 1 student, I've given them simple advice.
First, let the college know you want a spot.
Second, send the college rep only new information - new awards, new recognitions, new grades, etc.
Third, consider sending the college rep a short, new essay on why that college.
Fourth, try to seek out an alumni of that college who knows you and can advocate for you in a letter.
Most college reps won't admit this, but they are tired. So keep everything tight, terse, and brief.
Fifth, plan on depositing May 1st to an admitted college.
Many colleges will not go to their wait list until after May 1st when they get a clearer picture of what spots are open.
That's it.
Wait list, unfortunately, require waiting.
And sometimes good things come to those who wait.
And other times - they don't.
That proverbial wisdom often proves true for finding a spouse. Or getting a great deal on a car.
But not necessarily a spot at a desired college.
A recent article enumerated on anticipated wait list trends this year.
Here are a handful of more statistics from that article.
About 55% of colleges will create and use a wait list.
Most of those 55% will put roughly 9% of their application pool on the wait list.
Cornell is a great example of this trend. Cornell had 40,006 applications. They put 3,146 on the wait list.
Some schools will put more. Take Emory. They had 17,698 applications. They put 4,113 on the wait list.
Some will put less. Take Princeton. They had 26, 498. They put 1,395 on the wait list.
The Times recently posted admission statistics for many highly selective schools. They also provided wait list numbers. Click here to review statistics.
Overall, colleges are taking on average 31% from the wait list.
Notably, highly selective schools are taking almost 17% from their wait list.
Usually, I tell my kids that the more selective the school is, the less likely they will be admitted off the waist list. In that case, I tell my kids to see a wait list as a consolation prize, and that they need to move forward, deposit May 1st at a school that has admitted them, buy the t-shirt, and celebrate the exciting opportunities that await them in the next chapter of their life story.
Wednesday, March 27, 2013
2...1...
2.
1.
now click.
36 of our seniors will hear back on 96 application decisions.
It's certain to be a mixed bag.
Or like my golf game - a combination of birdies, pars, and quadruple bogies.
My colleague at a prestigious independent school in the northeast recently texted me these macabresque four words:
"Regular admission is dead."
At highly selective schools, in particular, it seems that the sheer, absurd, colossal numbers are going to bury most applicants like an avalanche.

It seems that if a kid wants a school that admits 25% or less, their best shot, and in most cases, their only shot, in fact, is early admission.
Early.
Or nothing.
Recently, there was an article in Time entitled "College Admissions: The Myth of High Selectivity."
The argument is that it is actually easier to get into a highly selective school.
Maybe not THE highly selective school of choice.
But A highly selective school of choice.
The argument revolves around the central idea that more unqualified students are applying just because they can thanks to the easy accessibility via the Common Application.
We call these applicants "profile negative" students.
GPA and test scores are below the 50% median.
I'm sure that cohort of applicants is growing.
But most deans of admission tell college counselors like myself just the opposite.
They are fomenting our anxiety with the growing cohort of qualified students.
They are "profile positive."
Take this interview with Maria Laskaris, Dean of Admission at Dartmouth College.
At one point, Mrs. Laskaris said this about the overall quality of the admission pool:
"Probably 85 to 90 percent of the pool, if given the opportunity, would thrive, would excel, so we’re making very nuanced and difficult decisions, and it gets harder and harder, as you winnow the pool down, to figure out whom we’re going to admit."
85 to 90%.
So of the 8 out of 10 that are admissible, Dartmouth then will admit 1 out of those 8.
That's the same set of numbers I heard from Bill Fitzsimmons at Harvard.
Same number I just got on the phone from our rep at Vandy who told me that they got over 31,000 applications in this year's admission cycle.
Just today, in fact, The Times ran an article on tips for being accepted.
The thrust of the article is when you get your acceptance letter - be happy, relieved, jubilant...but don't go "Rod Tidwell" overboard and get flagged 15 yards by your peers.
My guess is that the Rod Tidwell touchdown dances will be far-and-in-between the crawl-into-the-fetal-position-and-spoon-down-ben-and-jerry's-ice-cream.

In other words, more of these cringing responses.
Than the above.
So my final thought as the curtain lifts in the next 24 hours.
If you are one of the few who get in at highly selective schools - count yourself lucky, because the truth is, that decision doesn't reflect as much your admissibility as it does the absurdity of the process.
And if you are one of the many who do not get in - know that the decision doesn't reflect as much your inadmissibility as it does the absurdity of the process.
1.
now click.
36 of our seniors will hear back on 96 application decisions.
It's certain to be a mixed bag.
Or like my golf game - a combination of birdies, pars, and quadruple bogies.
My colleague at a prestigious independent school in the northeast recently texted me these macabresque four words:
"Regular admission is dead."
At highly selective schools, in particular, it seems that the sheer, absurd, colossal numbers are going to bury most applicants like an avalanche.
It seems that if a kid wants a school that admits 25% or less, their best shot, and in most cases, their only shot, in fact, is early admission.
Early.
Or nothing.
Recently, there was an article in Time entitled "College Admissions: The Myth of High Selectivity."
The argument is that it is actually easier to get into a highly selective school.
Maybe not THE highly selective school of choice.
But A highly selective school of choice.
The argument revolves around the central idea that more unqualified students are applying just because they can thanks to the easy accessibility via the Common Application.
We call these applicants "profile negative" students.
GPA and test scores are below the 50% median.
I'm sure that cohort of applicants is growing.
But most deans of admission tell college counselors like myself just the opposite.
They are fomenting our anxiety with the growing cohort of qualified students.
They are "profile positive."
Take this interview with Maria Laskaris, Dean of Admission at Dartmouth College.
At one point, Mrs. Laskaris said this about the overall quality of the admission pool:
"Probably 85 to 90 percent of the pool, if given the opportunity, would thrive, would excel, so we’re making very nuanced and difficult decisions, and it gets harder and harder, as you winnow the pool down, to figure out whom we’re going to admit."
85 to 90%.
So of the 8 out of 10 that are admissible, Dartmouth then will admit 1 out of those 8.
That's the same set of numbers I heard from Bill Fitzsimmons at Harvard.
Same number I just got on the phone from our rep at Vandy who told me that they got over 31,000 applications in this year's admission cycle.
Just today, in fact, The Times ran an article on tips for being accepted.
The thrust of the article is when you get your acceptance letter - be happy, relieved, jubilant...but don't go "Rod Tidwell" overboard and get flagged 15 yards by your peers.
My guess is that the Rod Tidwell touchdown dances will be far-and-in-between the crawl-into-the-fetal-position-and-spoon-down-ben-and-jerry's-ice-cream.

In other words, more of these cringing responses.
Than the above.
So my final thought as the curtain lifts in the next 24 hours.
If you are one of the few who get in at highly selective schools - count yourself lucky, because the truth is, that decision doesn't reflect as much your admissibility as it does the absurdity of the process.
And if you are one of the many who do not get in - know that the decision doesn't reflect as much your inadmissibility as it does the absurdity of the process.
Thursday, March 14, 2013
Discovering Your Story, Part I
This month's theme for the College Seminar is story.
I invited a guest speaker to engage our 11th graders on the compelling power of story.
Our guest speaker has hired and fired many salesman in the corporate world of healthcare management.
He opened with our students by saying, "I've never hired a person with the best resume. I've always hired the person with a good resume and an even better story."
 Does a really good story make that much of a difference?
In a job interview?
On a college application?
In life - in general?
I would argue, Yes!
What is a story?
A story is what you do.
Think about what you do?
We are in touch with these because this is where we spend all of our time.
This stuff makes up 90% of our conversations - doesn't it?
But your story is more than what you do.
Your story is also who you are.
Now think about who you are?
You are shaped by your experiences, family, life events, etc.
You are unique - like your thumbprint.
And this sets you apart.
Informs your character and passions.
Makes you "come alive" to those around you.
Comes from "the heart" more than "the head."
Your story then is what you do + who you are.
I invited a guest speaker to engage our 11th graders on the compelling power of story.
Our guest speaker has hired and fired many salesman in the corporate world of healthcare management.
He opened with our students by saying, "I've never hired a person with the best resume. I've always hired the person with a good resume and an even better story."

In a job interview?
On a college application?
In life - in general?
I would argue, Yes!
What is a story?
A story is what you do.
Think about what you do?
- School
- GPA
- SAT/ACT Scores
- Clubs
- Activities
- Service Hours
- Athletics (JV/V...start/don't start)
- Work
- Vocational Aspirations
We are in touch with these because this is where we spend all of our time.
This stuff makes up 90% of our conversations - doesn't it?
But your story is more than what you do.
Your story is also who you are.
Now think about who you are?
You are shaped by your experiences, family, life events, etc.
You are unique - like your thumbprint.
And this sets you apart.
Informs your character and passions.
Makes you "come alive" to those around you.
Comes from "the heart" more than "the head."
Your story then is what you do + who you are.
Subscribe to:
Posts (Atom)


