


The Class of 2012 averaged 4.3 applications per student.
The first pie chart below illustrates the break down between seniors who put an application into one of the four "early buckets" (Early Decision 1, Early Decision 2, Early Action, Single Choice Early Action), and those who put an application in the "regular buckets" (Rolling and Regular).

The next pie chart breaks down admission results. Our admit rate overall continues to improve every year (some argue we're "hedging our bets" with where our students apply; others would argue that we are doing a more effective job of "identifying best college fits" for our students). The "unknown" results represent students who were placed on wait lists at school.

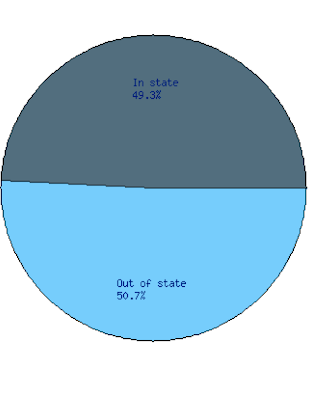
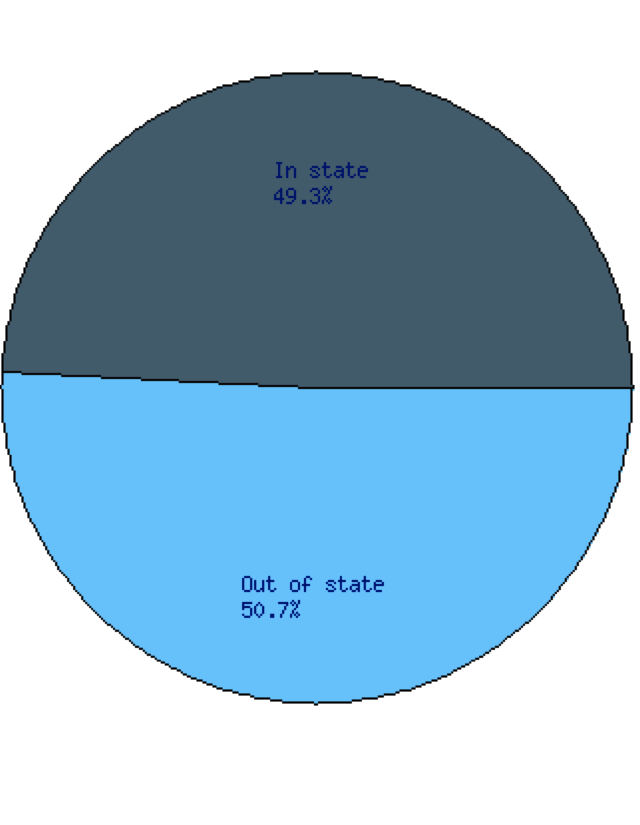
The final pie chart breaks down our In State to Out of State matriculation. We are certainly seeing a new trend toward more students choosing to stay inside our state borders. To date we have 23 seniors matriculating to OU, 8 to OK State, 2 to Tulsa, 1 to OCU. Affordability, distance from home, the draw of "big, rah-rah sports with thriving Greek life", the way President Boren has "made OU cool", did I mention football?, and all the buzz and excitement swirling around the progress and development in Oklahoma (Thunder, Devon Energy Building, etc) - these reasons and many others have contributed to the "tipping point" in terms of more of our kids staying inside.
(* we currently have 5 seniors who have not chosen their college destination. )